Note
Click here to download the full example code
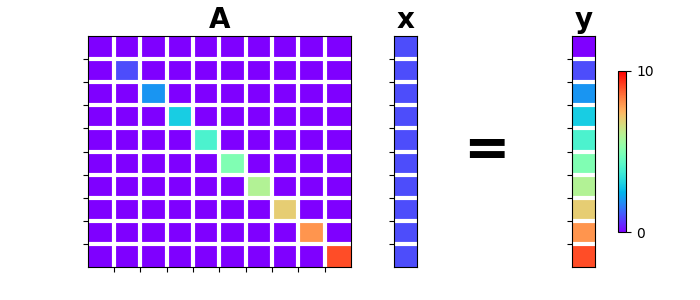
Diagonal
This example shows how to use the pylops.Diagonal operator
to perform Element-wise multiplication between the input vector and a vector \(\mathbf{d}\).
In other words, the operator acts as a diagonal operator \(\mathbf{D}\) whose elements along the diagonal are the elements of the vector \(\mathbf{d}\).
import numpy as np
import matplotlib.pyplot as plt
import matplotlib.gridspec as pltgs

import pylops

plt.close('all')
Let’s define a diagonal operator \(\mathbf{d}\) with increasing numbers from
0 to N and a unitary model \(\mathbf{x}\).
N = 10
d = np.arange(N)
x = np.ones(N)

Dop = pylops.Diagonal(d)

y = Dop*x
y1 = Dop.H*x

gs = pltgs.GridSpec(1, 6)
fig = plt.figure(figsize=(7, 3))
ax = plt.subplot(gs[0, 0:3])
im = ax.imshow(Dop.matrix(), cmap='rainbow', vmin=0, vmax=N)
ax.set_title('A', size=20, fontweight='bold')
ax.set_xticks(np.arange(N-1)+0.5)
ax.set_yticks(np.arange(N-1)+0.5)
ax.grid(linewidth=3, color='white')
ax.xaxis.set_ticklabels([])
ax.yaxis.set_ticklabels([])
ax.axis('tight')
ax = plt.subplot(gs[0, 3])
ax.imshow(x[:, np.newaxis], cmap='rainbow', vmin=0, vmax=N)
ax.set_title('x', size=20, fontweight='bold')
ax.set_xticks([])
ax.set_yticks(np.arange(N-1)+0.5)
ax.grid(linewidth=3, color='white')
ax.xaxis.set_ticklabels([])
ax.yaxis.set_ticklabels([])
ax = plt.subplot(gs[0, 4])
ax.text(0.35, 0.5, '=', horizontalalignment='center',
        verticalalignment='center', size=40, fontweight='bold')
ax.axis('off')
ax = plt.subplot(gs[0, 5])
ax.imshow(y[:, np.newaxis], cmap='rainbow', vmin=0, vmax=N)
ax.set_title('y', size=20, fontweight='bold')
ax.set_xticks([])
ax.set_yticks(np.arange(N - 1) + 0.5)
ax.grid(linewidth=3, color='white')
ax.xaxis.set_ticklabels([])
ax.yaxis.set_ticklabels([])
fig.colorbar(im, ax=ax, ticks=[0, N], pad=0.3, shrink=0.7)
Out:
<matplotlib.colorbar.Colorbar object at 0x7f7abb35a470>
Similarly we can consider the input model as composed of two or more dimensions. In this case the diagonal operator can be still applied to each element or broadcasted along a specific direction. Let’s start with the simplest case where each element is multipled by a different value
Out:
x =
[[1. 1. 1. 1. 1.]
 [1. 1. 1. 1. 1.]
 [1. 1. 1. 1. 1.]]
y = D*x =
[[ 0.  1.  2.  3.  4.]
 [ 5.  6.  7.  8.  9.]
 [10. 11. 12. 13. 14.]]
xadj = D'*x =
[[ 0.  1.  2.  3.  4.]
 [ 5.  6.  7.  8.  9.]
 [10. 11. 12. 13. 14.]]
And we now broadcast
nx, ny = 3, 5
x = np.ones((nx, ny))
print('x =\n%s' % x)

# 1st dim
d = np.arange(nx)
Dop = pylops.Diagonal(d, dims=(nx, ny), dir=0)

y = Dop*x.flatten()
y1 = Dop.H*x.flatten()

print('1st dim: y = D*x =\n%s' % y.reshape(nx, ny))
print('1st dim: xadj = D\'*x =\n%s ' % y1.reshape(nx, ny))

# 2nd dim
d = np.arange(ny)
Dop = pylops.Diagonal(d, dims=(nx, ny), dir=1)

y = Dop*x.flatten()
y1 = Dop.H*x.flatten()

print('2nd dim: y = D*x =\n%s' % y.reshape(nx, ny))
print('2nd dim: xadj = D\'*x =\n%s ' % y1.reshape(nx, ny))
Out:
x =
[[1. 1. 1. 1. 1.]
 [1. 1. 1. 1. 1.]
 [1. 1. 1. 1. 1.]]
1st dim: y = D*x =
[[0. 0. 0. 0. 0.]
 [1. 1. 1. 1. 1.]
 [2. 2. 2. 2. 2.]]
1st dim: xadj = D'*x =
[[0. 0. 0. 0. 0.]
 [1. 1. 1. 1. 1.]
 [2. 2. 2. 2. 2.]]
2nd dim: y = D*x =
[[0. 1. 2. 3. 4.]
 [0. 1. 2. 3. 4.]
 [0. 1. 2. 3. 4.]]
2nd dim: xadj = D'*x =
[[0. 1. 2. 3. 4.]
 [0. 1. 2. 3. 4.]
 [0. 1. 2. 3. 4.]]
Total running time of the script: ( 0 minutes 0.250 seconds)