Note
Click here to download the full example code
Flip along an axis
This example shows how to use the pylops.Flip
operator to simply flip an input signal along an axis.
import matplotlib.pyplot as plt
import numpy as np

import pylops

plt.close("all")
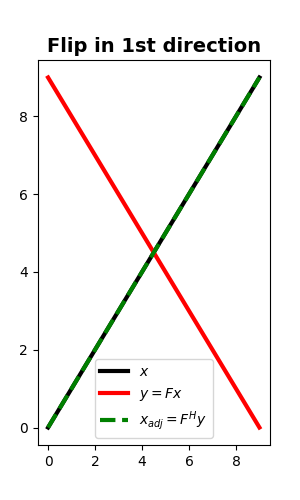
Let’s start with a 1D example. Define an input signal composed of
nt samples
We can now create our flip operator and apply it to the input signal. We can also apply the adjoint to the flipped signal and we can see how for this operator the adjoint is effectively equivalent to the inverse.
Out:
<matplotlib.legend.Legend object at 0x7f6aee2f0208>
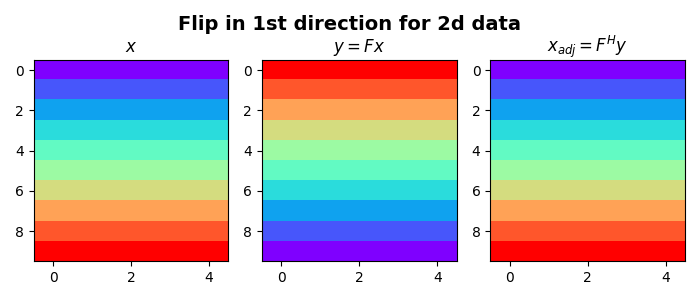
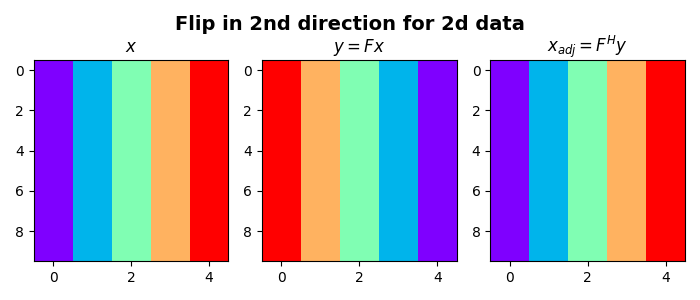
Let’s now repeat the same exercise on a two dimensional signal. We will first flip the model along the first axis and then along the second axis
nt, nx = 10, 5
x = np.outer(np.arange(nt), np.ones(nx))
Fop = pylops.Flip(nt * nx, dims=(nt, nx), dir=0)
y = Fop * x.ravel()
xadj = Fop.H * y.ravel()
y = y.reshape(nt, nx)
xadj = xadj.reshape(nt, nx)

fig, axs = plt.subplots(1, 3, figsize=(7, 3))
fig.suptitle(
    "Flip in 1st direction for 2d data", fontsize=14, fontweight="bold", y=0.95
)
axs[0].imshow(x, cmap="rainbow")
axs[0].set_title(r"$x$")
axs[0].axis("tight")
axs[1].imshow(y, cmap="rainbow")
axs[1].set_title(r"$y = F x$")
axs[1].axis("tight")
axs[2].imshow(xadj, cmap="rainbow")
axs[2].set_title(r"$x_{adj} = F^H y$")
axs[2].axis("tight")
plt.tight_layout()
plt.subplots_adjust(top=0.8)


x = np.outer(np.ones(nt), np.arange(nx))
Fop = pylops.Flip(nt * nx, dims=(nt, nx), dir=1)
y = Fop * x.ravel()
xadj = Fop.H * y.ravel()
y = y.reshape(nt, nx)
xadj = xadj.reshape(nt, nx)

# sphinx_gallery_thumbnail_number = 3
fig, axs = plt.subplots(1, 3, figsize=(7, 3))
fig.suptitle(
    "Flip in 2nd direction for 2d data", fontsize=14, fontweight="bold", y=0.95
)
axs[0].imshow(x, cmap="rainbow")
axs[0].set_title(r"$x$")
axs[0].axis("tight")
axs[1].imshow(y, cmap="rainbow")
axs[1].set_title(r"$y = F x$")
axs[1].axis("tight")
axs[2].imshow(xadj, cmap="rainbow")
axs[2].set_title(r"$x_{adj} = F^H y$")
axs[2].axis("tight")
plt.tight_layout()
plt.subplots_adjust(top=0.8)
Total running time of the script: ( 0 minutes 0.673 seconds)