Note
Click here to download the full example code
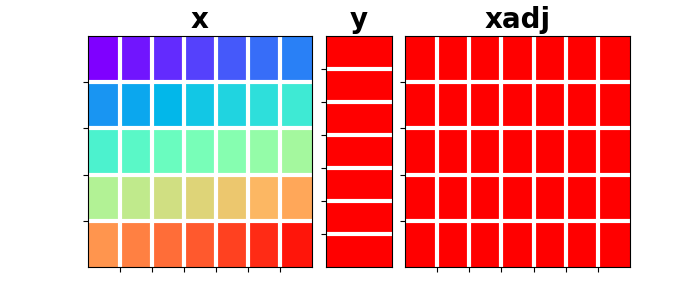
Sum
This example shows how to use the pylops.Sum operator to stack
values along an axis of a multi-dimensional array
import matplotlib.gridspec as pltgs
import matplotlib.pyplot as plt
import numpy as np

import pylops

plt.close("all")
Let’s start by defining a 2-dimensional data
We can now create the operator and peform forward and adjoint
Sop = pylops.Sum(dims=(ny, nx), dir=0)

y = Sop * x.ravel()
xadj = Sop.H * y
xadj = xadj.reshape(ny, nx)

gs = pltgs.GridSpec(1, 7)
fig = plt.figure(figsize=(7, 3))
ax = plt.subplot(gs[0, 0:3])
im = ax.imshow(x, cmap="rainbow", vmin=0, vmax=ny * nx)
ax.set_title("x", size=20, fontweight="bold")
ax.set_xticks(np.arange(nx - 1) + 0.5)
ax.set_yticks(np.arange(ny - 1) + 0.5)
ax.grid(linewidth=3, color="white")
ax.xaxis.set_ticklabels([])
ax.yaxis.set_ticklabels([])
ax.axis("tight")
ax = plt.subplot(gs[0, 3])
ax.imshow(y[:, np.newaxis], cmap="rainbow", vmin=0, vmax=ny * nx)
ax.set_title("y", size=20, fontweight="bold")
ax.set_xticks([])
ax.set_yticks(np.arange(nx - 1) + 0.5)
ax.grid(linewidth=3, color="white")
ax.xaxis.set_ticklabels([])
ax.yaxis.set_ticklabels([])
ax.axis("tight")
ax = plt.subplot(gs[0, 4:])
ax.imshow(xadj, cmap="rainbow", vmin=0, vmax=ny * nx)
ax.set_title("xadj", size=20, fontweight="bold")
ax.set_xticks(np.arange(nx - 1) + 0.5)
ax.set_yticks(np.arange(ny - 1) + 0.5)
ax.grid(linewidth=3, color="white")
ax.xaxis.set_ticklabels([])
ax.yaxis.set_ticklabels([])
ax.axis("tight")
Out:
(-0.5, 6.5, 4.5, -0.5)
Note that since the Sum operator creates and under-determined system of equations (data has always lower dimensionality than the model), an exact inverse is not possible for this operator.
Total running time of the script: ( 0 minutes 0.137 seconds)