Note
Click here to download the full example code
Padding
This example shows how to use the pylops.Pad operator to zero-pad a
model
import matplotlib.gridspec as pltgs
import matplotlib.pyplot as plt
import numpy as np

import pylops

plt.close("all")
Let’s define a pad operator Pop for one dimensional data
Out:
x = [ 1.  2.  3.  4.  5.  6.  7.  8.  9. 10.]
P*x = [ 0.  0.  1.  2.  3.  4.  5.  6.  7.  8.  9. 10.  0.  0.  0.]
P'*y = [ 1.  2.  3.  4.  5.  6.  7.  8.  9. 10.]
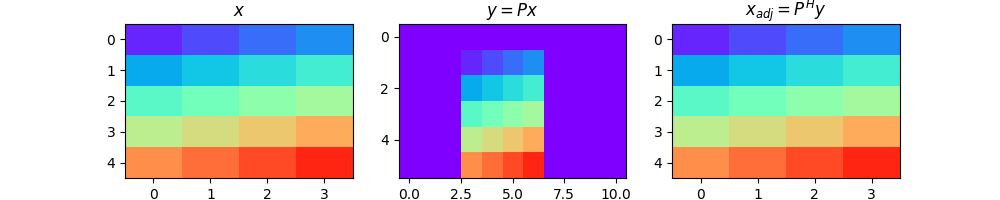
We move now to a multi-dimensional case. We pad the input model with different extents along both dimensions
dims = (5, 4)
pad = ((1, 0), (3, 4))

Pop = pylops.Pad(dims, pad)

x = (np.arange(np.prod(np.array(dims))) + 1.0).reshape(dims)
y = Pop * x.ravel()
xadj = Pop.H * y

y = y.reshape(Pop.dimsd)
xadj = xadj.reshape(dims)

fig, axs = plt.subplots(1, 3, figsize=(10, 2))
fig.suptitle("Pad for 2d data", fontsize=14, fontweight="bold", y=1.15)
axs[0].imshow(x, cmap="rainbow", vmin=0, vmax=np.prod(np.array(dims)) + 1)
axs[0].set_title(r"$x$")
axs[0].axis("tight")
axs[1].imshow(y, cmap="rainbow", vmin=0, vmax=np.prod(np.array(dims)) + 1)
axs[1].set_title(r"$y = P x$")
axs[1].axis("tight")
axs[2].imshow(xadj, cmap="rainbow", vmin=0, vmax=np.prod(np.array(dims)) + 1)
axs[2].set_title(r"$x_{adj} = P^{H} y$")
axs[2].axis("tight")
Out:
(-0.5, 3.5, 4.5, -0.5)
Total running time of the script: ( 0 minutes 0.208 seconds)