Note
Click here to download the full example code
Roll
This example shows how to use the pylops.Roll operator.
This operator simply shifts elements of multi-dimensional array along a specified direction a chosen number of samples.
import matplotlib.pyplot as plt
import numpy as np

import pylops

plt.close("all")
Let’s start with a 1d example. We make a signal, shift it by two samples and then shift it back using its adjoint. We can immediately see how the adjoint of this operator is equivalent to its inverse.
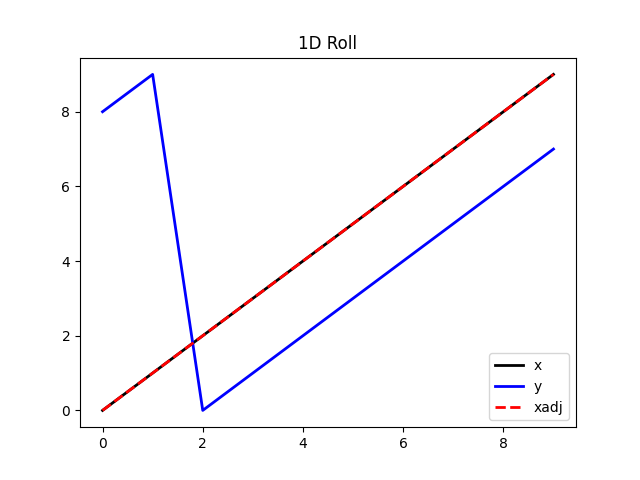
Out:
<matplotlib.legend.Legend object at 0x7f90cd140be0>
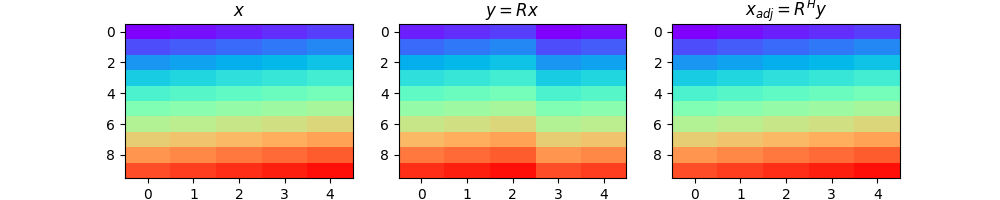
We can now do the same with a 2d array.
ny, nx = 10, 5
x = np.arange(ny * nx).reshape(ny, nx)

Rop = pylops.Roll(ny * nx, dims=(ny, nx), dir=1, shift=-2)

y = Rop * x.ravel()
xadj = Rop.H * y

y = y.reshape(ny, nx)
xadj = xadj.reshape(ny, nx)

fig, axs = plt.subplots(1, 3, figsize=(10, 2))
fig.suptitle("Roll for 2d data", fontsize=14, fontweight="bold", y=1.15)
axs[0].imshow(x, cmap="rainbow", vmin=0, vmax=50)
axs[0].set_title(r"$x$")
axs[0].axis("tight")
axs[1].imshow(y, cmap="rainbow", vmin=0, vmax=50)
axs[1].set_title(r"$y = R x$")
axs[1].axis("tight")
axs[2].imshow(xadj, cmap="rainbow", vmin=0, vmax=50)
axs[2].set_title(r"$x_{adj} = R^H y$")
axs[2].axis("tight")
Out:
(-0.5, 4.5, 9.5, -0.5)
Total running time of the script: ( 0 minutes 0.316 seconds)