Note
Click here to download the full example code
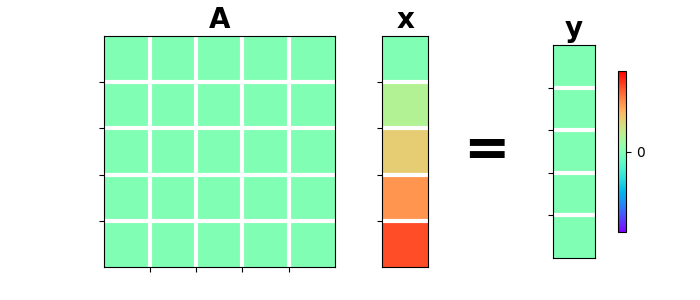
Zero
This example shows how to use the pylops.basicoperators.Zero operator.
This operators simply zeroes the data in forward mode and the model in adjoint mode.
import matplotlib.gridspec as pltgs
import matplotlib.pyplot as plt
import numpy as np

import pylops

plt.close("all")
Let’s define an zero operator \(\mathbf{0}\) with same number of elements for data \(N\) and model \(M\).
N, M = 5, 5
x = np.arange(M)
Zop = pylops.basicoperators.Zero(M, dtype="int")

y = Zop * x
xadj = Zop.H * y

gs = pltgs.GridSpec(1, 6)
fig = plt.figure(figsize=(7, 3))
ax = plt.subplot(gs[0, 0:3])
ax.imshow(np.zeros((N, N)), cmap="rainbow", vmin=-M, vmax=M)
ax.set_title("A", size=20, fontweight="bold")
ax.set_xticks(np.arange(N - 1) + 0.5)
ax.set_yticks(np.arange(M - 1) + 0.5)
ax.grid(linewidth=3, color="white")
ax.xaxis.set_ticklabels([])
ax.yaxis.set_ticklabels([])
ax = plt.subplot(gs[0, 3])
im = ax.imshow(x[:, np.newaxis], cmap="rainbow", vmin=-M, vmax=M)
ax.set_title("x", size=20, fontweight="bold")
ax.set_xticks([])
ax.set_yticks(np.arange(M - 1) + 0.5)
ax.grid(linewidth=3, color="white")
ax.xaxis.set_ticklabels([])
ax.yaxis.set_ticklabels([])
ax = plt.subplot(gs[0, 4])
ax.text(
    0.35,
    0.5,
    "=",
    horizontalalignment="center",
    verticalalignment="center",
    size=40,
    fontweight="bold",
)
ax.axis("off")
ax = plt.subplot(gs[0, 5])
ax.imshow(y[:, np.newaxis], cmap="rainbow", vmin=-M, vmax=M)
ax.set_title("y", size=20, fontweight="bold")
ax.set_xticks([])
ax.set_yticks(np.arange(N - 1) + 0.5)
ax.grid(linewidth=3, color="white")
ax.xaxis.set_ticklabels([])
ax.yaxis.set_ticklabels([])
fig.colorbar(im, ax=ax, ticks=[0], pad=0.3, shrink=0.7)
Out:
<matplotlib.colorbar.Colorbar object at 0x7f90d0b27710>
Similarly we can consider the case with data bigger than model
Out:
x = [0 1 2 3 4]
0*x = [0 0 0 0 0 0 0 0 0 0]
0'*y = [0 0 0 0 0]
and model bigger than data
Out:
x = [0 1 2 3 4 5 6 7 8 9]
0*x = [0 0 0 0 0]
0'*y = [0 0 0 0 0 0 0 0 0 0]
Note that this operator can be useful in many real-life applications when for example we want to manipulate a subset of the model array and keep intact the rest of the array. For example:
\[\begin{split}\begin{bmatrix} \mathbf{A} \quad \mathbf{0} \end{bmatrix} \begin{bmatrix} \mathbf{x_1} \\ \mathbf{x_2} \end{bmatrix} = \mathbf{A} \mathbf{x_1}\end{split}\]
Refer to the tutorial on Optimization for more details on this.
Total running time of the script: ( 0 minutes 0.164 seconds)