Ctrl+K
PyLops - Home
  • Overview
  • Installation
  • GPU / TPU Support
  • Extensions
  • Tutorials
    • Gallery
    • FAQs
    • PyLops API
    • PyLops Utilities
    • Implementing new operators
    • Implementing new solvers
    • Contributing
    • Changelog
    • Roadmap
    • Papers using PyLops
    • How to cite
    • Credits
  • GitHub
  • Overview
  • Installation
  • GPU / TPU Support
  • Extensions
  • Tutorials
  • Gallery
  • FAQs
  • PyLops API
  • PyLops Utilities
  • Implementing new operators
  • Implementing new solvers
  • Contributing
  • Changelog
  • Roadmap
  • Papers using PyLops
  • How to cite
  • Credits
  • GitHub

Section Navigation

  • 1D Smoothing
  • 1D, 2D and 3D Sliding
  • 2D Smoothing
  • AVO modelling
  • Acoustic Wave Equation modelling
  • Bayesian Linear Regression
  • Bilinear Interpolation
  • Blending
  • CGLS and LSQR Solvers
  • Causal Integration
  • Chirp Radon Transform
  • Conj
  • Convolution
  • Derivatives
  • Describe
  • Diagonal
  • Discrete Cosine Transform
  • Dual-Tree Complex Wavelet Transform
  • Flip along an axis
  • Fourier Radon Transform
  • Fourier Transform
  • Identity
  • Imag
  • L1-L1 IRLS
  • Linear Regression
  • MP, OMP, ISTA and FISTA
  • Matrix Multiplication
  • Multi-Dimensional Convolution
  • Non-stationary Convolution
  • Non-stationary Filter Estimation
  • Normal Moveout (NMO) Correction
  • Operators concatenation
  • Operators with Multiprocessing
  • Padding
  • Patching
  • PhaseShift operator
  • Polynomial Regression
  • Pre-stack modelling
  • Radon Transform
  • Real
  • Restriction and Interpolation
  • Roll
  • Seislet transform
  • Shift
  • Slope estimation via Structure Tensor algorithm
  • Spread How-to
  • Sum
  • Symmetrize
  • Synthetic seismic
  • Tapers
  • Total Variation (TV) Regularization
  • Transpose
  • Wavelet estimation
  • Wavelet transform
  • Wavelets
  • Zero
  • Gallery
  • Identity

Note

Go to the end to download the full example code.
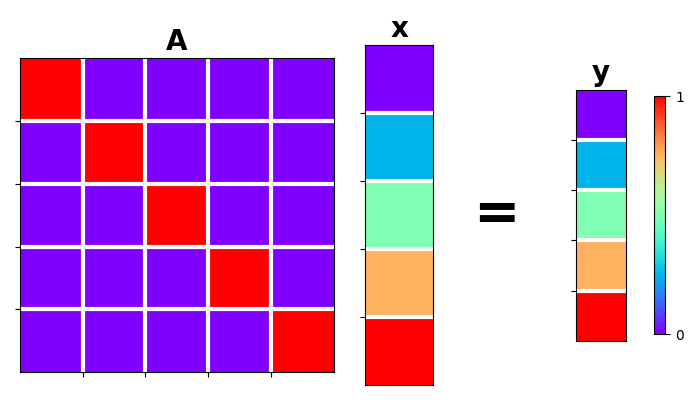
Identity#

This example shows how to use the pylops.Identity operator to transfer model into data and viceversa.

import matplotlib.gridspec as pltgs
import matplotlib.pyplot as plt
import numpy as np

import pylops

plt.close("all")

Let’s define an identity operator \(\mathbf{Iop}\) with same number of elements for data and model (\(N=M\)).

N, M = 5, 5
x = np.arange(M)
Iop = pylops.Identity(M, dtype="int")

y = Iop * x
xadj = Iop.H * y

gs = pltgs.GridSpec(1, 6)
fig = plt.figure(figsize=(7, 4))
ax = plt.subplot(gs[0, 0:3])
im = ax.imshow(np.eye(N), cmap="rainbow")
ax.set_title("A", size=20, fontweight="bold")
ax.set_xticks(np.arange(N - 1) + 0.5)
ax.set_yticks(np.arange(M - 1) + 0.5)
ax.grid(linewidth=3, color="white")
ax.xaxis.set_ticklabels([])
ax.yaxis.set_ticklabels([])
ax = plt.subplot(gs[0, 3])
ax.imshow(x[:, np.newaxis], cmap="rainbow")
ax.set_title("x", size=20, fontweight="bold")
ax.set_xticks([])
ax.set_yticks(np.arange(M - 1) + 0.5)
ax.grid(linewidth=3, color="white")
ax.xaxis.set_ticklabels([])
ax.yaxis.set_ticklabels([])
ax = plt.subplot(gs[0, 4])
ax.text(
    0.35,
    0.5,
    "=",
    horizontalalignment="center",
    verticalalignment="center",
    size=40,
    fontweight="bold",
)
ax.axis("off")
ax = plt.subplot(gs[0, 5])
ax.imshow(y[:, np.newaxis], cmap="rainbow")
ax.set_title("y", size=20, fontweight="bold")
ax.set_xticks([])
ax.set_yticks(np.arange(N - 1) + 0.5)
ax.grid(linewidth=3, color="white")
ax.xaxis.set_ticklabels([])
ax.yaxis.set_ticklabels([])
fig.colorbar(im, ax=ax, ticks=[0, 1], pad=0.3, shrink=0.7)
plt.tight_layout()
A, x, y

Similarly we can consider the case with data bigger than model

N, M = 10, 5
x = np.arange(M)
Iop = pylops.Identity(N, M, dtype="int")

y = Iop * x
xadj = Iop.H * y

print(f"x = {x} ")
print(f"I*x = {y} ")
print(f"I'*y = {xadj} ")
x = [0 1 2 3 4]
I*x = [0 1 2 3 4 0 0 0 0 0]
I'*y = [0 1 2 3 4]

and model bigger than data

N, M = 5, 10
x = np.arange(M)
Iop = pylops.Identity(N, M, dtype="int")

y = Iop * x
xadj = Iop.H * y

print(f"x = {x} ")
print(f"I*x = {y} ")
print(f"I'*y = {xadj} ")
x = [0 1 2 3 4 5 6 7 8 9]
I*x = [0 1 2 3 4]
I'*y = [0 1 2 3 4 0 0 0 0 0]

Note that this operator can be useful in many real-life applications when for example we want to manipulate a subset of the model array and keep intact the rest of the array. For example:

\[\begin{split}\begin{bmatrix} \mathbf{A} \quad \mathbf{I} \end{bmatrix} \begin{bmatrix} \mathbf{x_1} \\ \mathbf{x_2} \end{bmatrix} = \mathbf{A} \mathbf{x_1} + \mathbf{x_2}\end{split}\]

Refer to the tutorial on Optimization for more details on this.

Total running time of the script: (0 minutes 0.257 seconds)

Download Jupyter notebook: plot_identity.ipynb

Download Python source code: plot_identity.py

Download zipped: plot_identity.zip

Gallery generated by Sphinx-Gallery

previous

Fourier Transform

next

Imag

© Copyright 2024, PyLops Development Team.

Created using Sphinx 5.3.0.

Built with the PyData Sphinx Theme 0.15.4.