Note
Go to the end to download the full example code.
Roll
This example shows how to use the pylops.Roll operator.
This operator simply shifts elements of multi-dimensional array along a specified direction a chosen number of samples.
import matplotlib.pyplot as plt
import numpy as np

import pylops

plt.close("all")
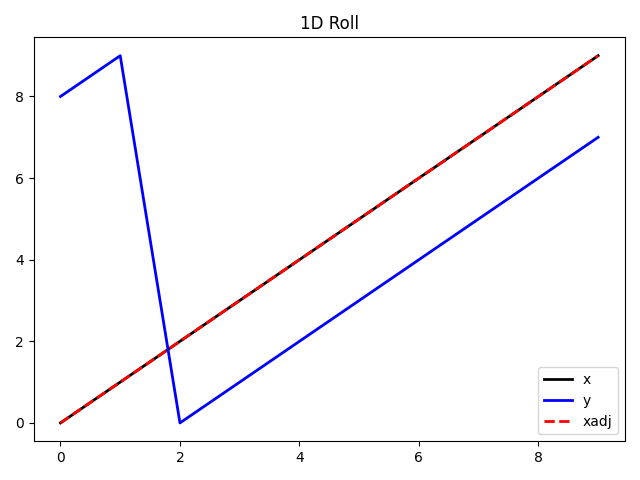
Let’s start with a 1d example. We make a signal, shift it by two samples and then shift it back using its adjoint. We can immediately see how the adjoint of this operator is equivalent to its inverse.
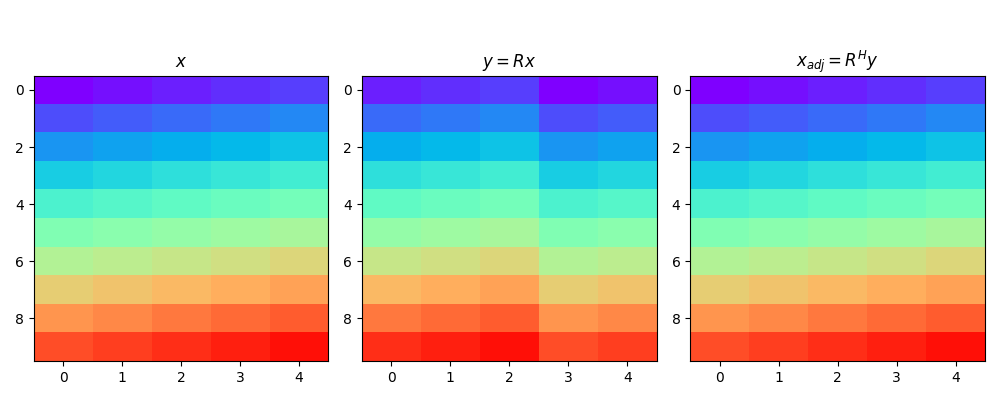
We can now do the same with a 2d array.
ny, nx = 10, 5
x = np.arange(ny * nx).reshape(ny, nx)

Rop = pylops.Roll(dims=(ny, nx), axis=1, shift=-2)

y = Rop * x
xadj = Rop.H * y

fig, axs = plt.subplots(1, 3, figsize=(10, 4))
fig.suptitle("Roll for 2d data", fontsize=14, fontweight="bold", y=1.15)
axs[0].imshow(x, cmap="rainbow", vmin=0, vmax=50)
axs[0].set_title(r"$x$")
axs[0].axis("tight")
axs[1].imshow(y, cmap="rainbow", vmin=0, vmax=50)
axs[1].set_title(r"$y = R x$")
axs[1].axis("tight")
axs[2].imshow(xadj, cmap="rainbow", vmin=0, vmax=50)
axs[2].set_title(r"$x_{adj} = R^H y$")
axs[2].axis("tight")
plt.tight_layout()
Total running time of the script: (0 minutes 0.330 seconds)