Note
Go to the end to download the full example code.
02. The Dot-Test
One of the most important aspect of writing a Linear operator is to be able
to verify that the code implemented in forward mode and the code implemented
in adjoint mode are effectively adjoint to each other. If this is the case,
your Linear operator will successfully pass the so-called dot-test.
Refer to the Notes section of pylops.utils.dottest)
for a more detailed description.
In this example, I will show you how to use the dot-test for a variety of operator when model and data are either real or complex numbers.
Let’s start with something very simple. We will make a pylops.MatrixMult
operator and verify that its implementation passes the dot-test.
For this time, we will do this step-by-step, replicating what happens in the
pylops.utils.dottest routine.
N, M = 5, 3
Mat = np.arange(N * M).reshape(N, M)
Op = pylops.MatrixMult(Mat)

v = np.random.randn(N)
u = np.random.randn(M)

# Op * u
y = Op.matvec(u)
# Op'* v
x = Op.rmatvec(v)

yy = np.dot(y, v)  # (Op  * u)' * v
xx = np.dot(u, x)  # u' * (Op' * v)

print(f"Dot-test {np.abs((yy - xx) / ((yy + xx + 1e-15) / 2)):.2e}")
Dot-test 1.37e-16
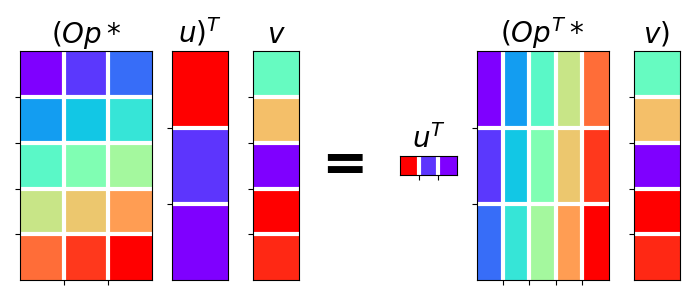
And here is a visual intepretation of what a dot-test is
gs = pltgs.GridSpec(1, 9)
fig = plt.figure(figsize=(7, 3))
ax = plt.subplot(gs[0, 0:2])
ax.imshow(Op.A, cmap="rainbow")
ax.set_title(r"$(Op*$", size=20, fontweight="bold")
ax.set_xticks(np.arange(M - 1) + 0.5)
ax.set_yticks(np.arange(N - 1) + 0.5)
ax.grid(linewidth=3, color="white")
ax.xaxis.set_ticklabels([])
ax.yaxis.set_ticklabels([])
ax.axis("tight")
ax = plt.subplot(gs[0, 2])
ax.imshow(u[:, np.newaxis], cmap="rainbow")
ax.set_title(r"$u)^T$", size=20, fontweight="bold")
ax.set_xticks([])
ax.set_yticks(np.arange(M - 1) + 0.5)
ax.grid(linewidth=3, color="white")
ax.xaxis.set_ticklabels([])
ax.yaxis.set_ticklabels([])
ax.axis("tight")
ax = plt.subplot(gs[0, 3])
ax.imshow(v[:, np.newaxis], cmap="rainbow")
ax.set_title(r"$v$", size=20, fontweight="bold")
ax.set_xticks([])
ax.set_yticks(np.arange(N - 1) + 0.5)
ax.grid(linewidth=3, color="white")
ax.xaxis.set_ticklabels([])
ax.yaxis.set_ticklabels([])
ax = plt.subplot(gs[0, 4])
ax.text(
    0.35,
    0.5,
    "=",
    horizontalalignment="center",
    verticalalignment="center",
    size=40,
    fontweight="bold",
)
ax.axis("off")
ax = plt.subplot(gs[0, 5])
ax.imshow(u[:, np.newaxis].T, cmap="rainbow")
ax.set_title(r"$u^T$", size=20, fontweight="bold")
ax.set_xticks(np.arange(M - 1) + 0.5)
ax.set_yticks([])
ax.grid(linewidth=3, color="white")
ax.xaxis.set_ticklabels([])
ax.yaxis.set_ticklabels([])
ax = plt.subplot(gs[0, 6:8])
ax.imshow(Op.A.T, cmap="rainbow")
ax.set_title(r"$(Op^T*$", size=20, fontweight="bold")
ax.set_xticks(np.arange(N - 1) + 0.5)
ax.set_yticks(np.arange(M - 1) + 0.5)
ax.grid(linewidth=3, color="white")
ax.xaxis.set_ticklabels([])
ax.yaxis.set_ticklabels([])
ax.axis("tight")
ax = plt.subplot(gs[0, 8])
ax.imshow(v[:, np.newaxis], cmap="rainbow")
ax.set_title(r"$v)$", size=20, fontweight="bold")
ax.set_xticks([])
ax.set_yticks(np.arange(N - 1) + 0.5)
ax.grid(linewidth=3, color="white")
ax.xaxis.set_ticklabels([])
ax.yaxis.set_ticklabels([])
plt.tight_layout()
From now on, we can simply use the pylops.utils.dottest implementation
of the dot-test and pass the operator we would like to validate,
its size in the model and data spaces and optionally the tolerance we will be
accepting for the dot-test to be considered succesfull. Finally we need to
specify if our data or/and model vectors contain complex numbers using the
complexflag parameter. While the dot-test will return True when
succesfull and False otherwise, we can also ask to print its outcome putting the
verb parameters to True.
Dot test passed, v^H(Opu)=-6.91965436475742 - u^H(Op^Hv)=-6.91965436475742
We move now to a more complicated operator, the pylops.signalprocessing.FFT
operator. We use once again the pylops.utils.dottest to verify its implementation
and since we are dealing with a transform that can be applied to both real and complex
array, we try different combinations using the complexflag input.
Dot test passed, v^H(Opu)=(-17.139103504227144+3.8288339959112494j) - u^H(Op^Hv)=(-17.13910350422714+3.828833995911253j)
Dot test passed, v^H(Opu)=(11.420800131114781-3.6881513292463293j) - u^H(Op^Hv)=(11.420800131114781-3.688151329246328j)
Total running time of the script: (0 minutes 0.198 seconds)