Note
Go to the end to download the full example code.
Tapers
This example shows how to create some basic tapers in 1d, 2d, and 3d
using the pylops.utils.tapers module.
import matplotlib.pyplot as plt

import pylops

plt.close("all")
Let’s first define the time and space axes
par = {
    "ox": -200,
    "dx": 2,
    "nx": 201,
    "oy": -100,
    "dy": 2,
    "ny": 101,
    "ot": 0,
    "dt": 0.004,
    "nt": 501,
    "ntapx": 21,
    "ntapy": 31,
}
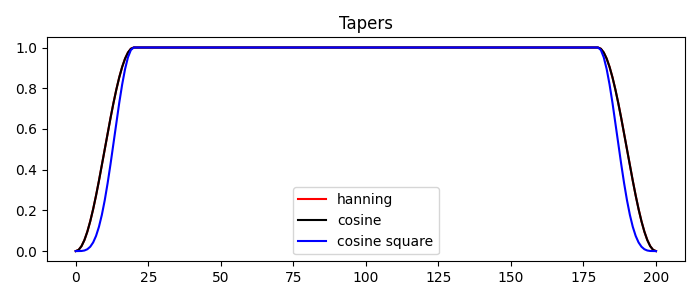
We can now create tapers in 1d
tap_han = pylops.utils.tapers.hanningtaper(par["nx"], par["ntapx"])
tap_cos = pylops.utils.tapers.cosinetaper(par["nx"], par["ntapx"], False)
tap_cos2 = pylops.utils.tapers.cosinetaper(par["nx"], par["ntapx"], True)

plt.figure(figsize=(7, 3))
plt.plot(tap_han, "r", label="hanning")
plt.plot(tap_cos, "k", label="cosine")
plt.plot(tap_cos2, "b", label="cosine square")
plt.title("Tapers")
plt.legend()
plt.tight_layout()
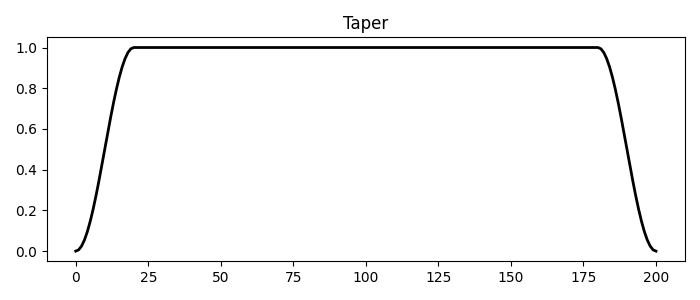
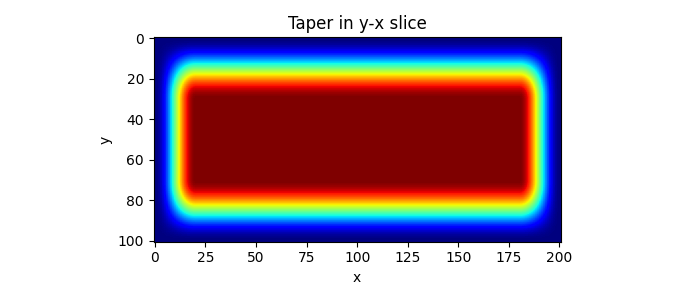
Similarly we can create 2d and 3d tapers with any of the tapers above
tap2d = pylops.utils.tapers.taper2d(par["nt"], par["nx"], par["ntapx"])

plt.figure(figsize=(7, 3))
plt.plot(tap2d[:, par["nt"] // 2], "k", lw=2)
plt.title("Taper")
plt.tight_layout()

tap3d = pylops.utils.tapers.taper3d(
    par["nt"], (par["ny"], par["nx"]), (par["ntapy"], par["ntapx"])
)

plt.figure(figsize=(7, 3))
plt.imshow(tap3d[:, :, par["nt"] // 2], "jet")
plt.title("Taper in y-x slice")
plt.xlabel("x")
plt.ylabel("y")
plt.tight_layout()
Total running time of the script: (0 minutes 0.301 seconds)