Note
Go to the end to download the full example code
14. Seismic wavefield decomposition#
Multi-component seismic data can be decomposed
in their up- and down-going constituents in a purely data driven fashion.
This task can be accurately achieved by linearly combining the input pressure
and particle velocity data in the frequency-wavenumber described in details in
pylops.waveeqprocessing.UpDownComposition2D and
pylops.waveeqprocessing.WavefieldDecomposition.
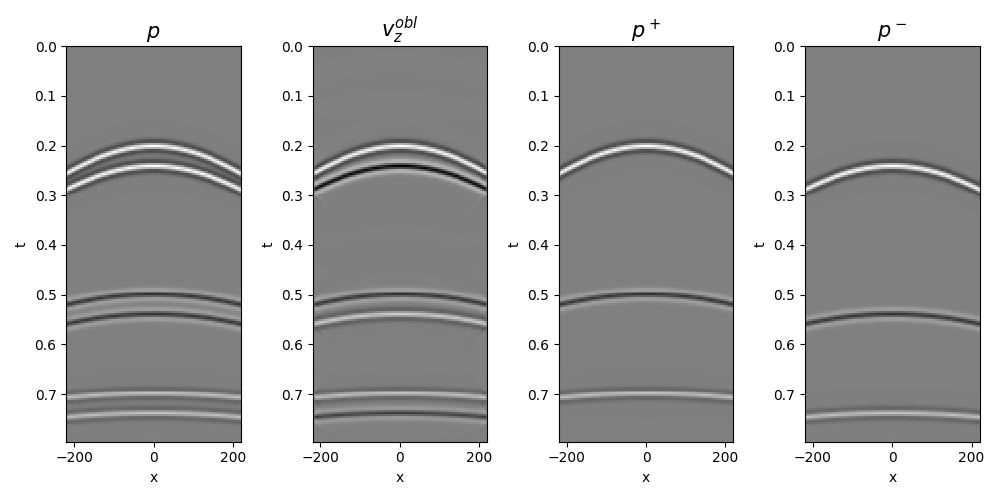
In this tutorial we will consider a simple synthetic data composed of six events (three up-going and three down-going). We will first combine them to create pressure and particle velocity data and then show how we can retrieve their directional constituents both by directly combining the input data as well as by setting an inverse problem. The latter approach results vital in case of spatial aliasing, as applying simple scaled summation in the frequency-wavenumber would result in sub-optimal decomposition due to the superposition of different frequency-wavenumber pairs at some (aliased) locations.
import matplotlib.pyplot as plt
import numpy as np
from scipy.signal import filtfilt

import pylops
from pylops.utils.seismicevents import hyperbolic2d, makeaxis
from pylops.utils.wavelets import ricker

np.random.seed(0)
plt.close("all")
Let’s first the input up- and down-going wavefields
par = {"ox": -220, "dx": 5, "nx": 89, "ot": 0, "dt": 0.004, "nt": 200, "f0": 40}

t0_plus = np.array([0.2, 0.5, 0.7])
t0_minus = t0_plus + 0.04
vrms = np.array([1400.0, 1500.0, 2000.0])
amp = np.array([1.0, -0.6, 0.5])
vel_sep = 1000.0  # velocity at separation level
rho_sep = 1000.0  # density at separation level

# Create axis
t, t2, x, y = makeaxis(par)

# Create wavelet
wav = ricker(t[:41], f0=par["f0"])[0]

# Create data
_, p_minus = hyperbolic2d(x, t, t0_minus, vrms, amp, wav)
_, p_plus = hyperbolic2d(x, t, t0_plus, vrms, amp, wav)
We can now combine them to create pressure and particle velocity data
critical = 1.1
ntaper = 51
nfft = 2**10

# 2d fft operator
FFTop = pylops.signalprocessing.FFT2D(
    dims=[par["nx"], par["nt"]], nffts=[nfft, nfft], sampling=[par["dx"], par["dt"]]
)

# obliquity factor
[Kx, F] = np.meshgrid(FFTop.f1, FFTop.f2, indexing="ij")
k = F / vel_sep
Kz = np.sqrt((k**2 - Kx**2).astype(np.complex128))
Kz[np.isnan(Kz)] = 0
OBL = rho_sep * (np.abs(F) / Kz)
OBL[Kz == 0] = 0

mask = np.abs(Kx) < critical * np.abs(F) / vel_sep
OBL *= mask
OBL = filtfilt(np.ones(ntaper) / float(ntaper), 1, OBL, axis=0)
OBL = filtfilt(np.ones(ntaper) / float(ntaper), 1, OBL, axis=1)

# composition operator
UPop = pylops.waveeqprocessing.UpDownComposition2D(
    par["nt"],
    par["nx"],
    par["dt"],
    par["dx"],
    rho_sep,
    vel_sep,
    nffts=(nfft, nfft),
    critical=critical * 100.0,
    ntaper=ntaper,
    dtype="complex128",
)

# wavefield modelling
d = UPop * np.concatenate((p_plus.ravel(), p_minus.ravel())).ravel()
d = np.real(d.reshape(2 * par["nx"], par["nt"]))
p, vz = d[: par["nx"]], d[par["nx"] :]

# obliquity scaled vz
VZ = FFTop * vz.ravel()
VZ = VZ.reshape(nfft, nfft)

VZ_obl = OBL * VZ
vz_obl = FFTop.H * VZ_obl.ravel()
vz_obl = np.real(vz_obl.reshape(par["nx"], par["nt"]))

fig, axs = plt.subplots(1, 4, figsize=(10, 5))
axs[0].imshow(
    p.T,
    aspect="auto",
    vmin=-1,
    vmax=1,
    interpolation="nearest",
    cmap="gray",
    extent=(x.min(), x.max(), t.max(), t.min()),
)
axs[0].set_title(r"$p$", fontsize=15)
axs[0].set_xlabel("x")
axs[0].set_ylabel("t")
axs[1].imshow(
    vz_obl.T,
    aspect="auto",
    vmin=-1,
    vmax=1,
    interpolation="nearest",
    cmap="gray",
    extent=(x.min(), x.max(), t.max(), t.min()),
)
axs[1].set_title(r"$v_z^{obl}$", fontsize=15)
axs[1].set_xlabel("x")
axs[1].set_ylabel("t")
axs[2].imshow(
    p_plus.T,
    aspect="auto",
    vmin=-1,
    vmax=1,
    interpolation="nearest",
    cmap="gray",
    extent=(x.min(), x.max(), t.max(), t.min()),
)
axs[2].set_title(r"$p^+$", fontsize=15)
axs[2].set_xlabel("x")
axs[2].set_ylabel("t")
axs[3].imshow(
    p_minus.T,
    aspect="auto",
    interpolation="nearest",
    cmap="gray",
    extent=(x.min(), x.max(), t.max(), t.min()),
    vmin=-1,
    vmax=1,
)
axs[3].set_title(r"$p^-$", fontsize=15)
axs[3].set_xlabel("x")
axs[3].set_ylabel("t")
plt.tight_layout()

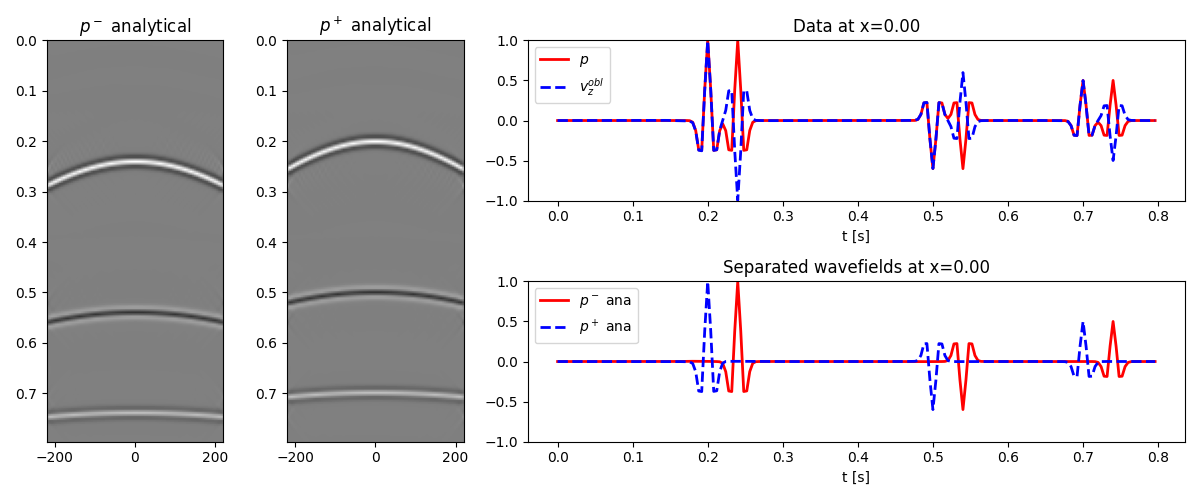
Wavefield separation is first performed using the analytical expression for combining pressure and particle velocity data in the wavenumber-frequency domain
pup_sep, pdown_sep = pylops.waveeqprocessing.WavefieldDecomposition(
    p,
    vz,
    par["nt"],
    par["nx"],
    par["dt"],
    par["dx"],
    rho_sep,
    vel_sep,
    nffts=(nfft, nfft),
    kind="analytical",
    critical=critical * 100,
    ntaper=ntaper,
    dtype="complex128",
)
fig = plt.figure(figsize=(12, 5))
axs0 = plt.subplot2grid((2, 5), (0, 0), rowspan=2)
axs1 = plt.subplot2grid((2, 5), (0, 1), rowspan=2)
axs2 = plt.subplot2grid((2, 5), (0, 2), colspan=3)
axs3 = plt.subplot2grid((2, 5), (1, 2), colspan=3)
axs0.imshow(
    pup_sep.T, cmap="gray", vmin=-1, vmax=1, extent=(x.min(), x.max(), t.max(), t.min())
)
axs0.set_title(r"$p^-$ analytical")
axs0.axis("tight")
axs1.imshow(
    pdown_sep.T,
    cmap="gray",
    vmin=-1,
    vmax=1,
    extent=(x.min(), x.max(), t.max(), t.min()),
)
axs1.set_title(r"$p^+$ analytical")
axs1.axis("tight")
axs2.plot(t, p[par["nx"] // 2], "r", lw=2, label=r"$p$")
axs2.plot(t, vz_obl[par["nx"] // 2], "--b", lw=2, label=r"$v_z^{obl}$")
axs2.set_ylim(-1, 1)
axs2.set_title("Data at x=%.2f" % x[par["nx"] // 2])
axs2.set_xlabel("t [s]")
axs2.legend()
axs3.plot(t, pup_sep[par["nx"] // 2], "r", lw=2, label=r"$p^-$ ana")
axs3.plot(t, pdown_sep[par["nx"] // 2], "--b", lw=2, label=r"$p^+$ ana")
axs3.set_title("Separated wavefields at x=%.2f" % x[par["nx"] // 2])
axs3.set_xlabel("t [s]")
axs3.set_ylim(-1, 1)
axs3.legend()
plt.tight_layout()

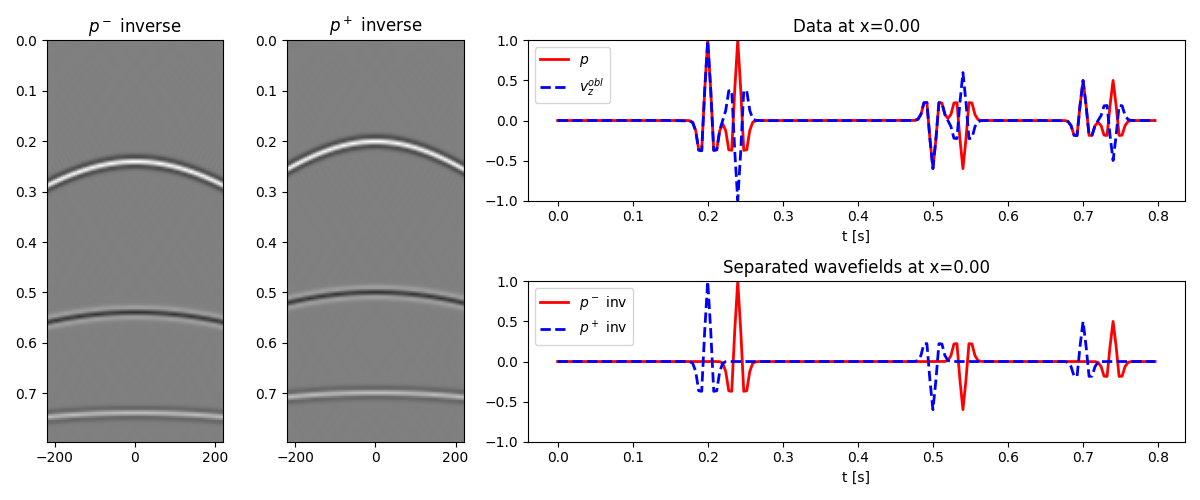
We repeat the same exercise but this time we invert the composition operator
pylops.waveeqprocessing.UpDownComposition2D
pup_inv, pdown_inv = pylops.waveeqprocessing.WavefieldDecomposition(
    p,
    vz,
    par["nt"],
    par["nx"],
    par["dt"],
    par["dx"],
    rho_sep,
    vel_sep,
    nffts=(nfft, nfft),
    kind="inverse",
    critical=critical * 100,
    ntaper=ntaper,
    scaling=1.0 / vz.max(),
    dtype="complex128",
    **dict(damp=1e-10, iter_lim=20)
)

fig = plt.figure(figsize=(12, 5))
axs0 = plt.subplot2grid((2, 5), (0, 0), rowspan=2)
axs1 = plt.subplot2grid((2, 5), (0, 1), rowspan=2)
axs2 = plt.subplot2grid((2, 5), (0, 2), colspan=3)
axs3 = plt.subplot2grid((2, 5), (1, 2), colspan=3)
axs0.imshow(
    pup_inv.T, cmap="gray", vmin=-1, vmax=1, extent=(x.min(), x.max(), t.max(), t.min())
)
axs0.set_title(r"$p^-$ inverse")
axs0.axis("tight")
axs1.imshow(
    pdown_inv.T,
    cmap="gray",
    vmin=-1,
    vmax=1,
    extent=(x.min(), x.max(), t.max(), t.min()),
)
axs1.set_title(r"$p^+$ inverse")
axs1.axis("tight")
axs2.plot(t, p[par["nx"] // 2], "r", lw=2, label=r"$p$")
axs2.plot(t, vz_obl[par["nx"] // 2], "--b", lw=2, label=r"$v_z^{obl}$")
axs2.set_ylim(-1, 1)
axs2.set_title("Data at x=%.2f" % x[par["nx"] // 2])
axs2.set_xlabel("t [s]")
axs2.legend()
axs3.plot(t, pup_inv[par["nx"] // 2], "r", lw=2, label=r"$p^-$ inv")
axs3.plot(t, pdown_inv[par["nx"] // 2], "--b", lw=2, label=r"$p^+$ inv")
axs3.set_title("Separated wavefields at x=%.2f" % x[par["nx"] // 2])
axs3.set_xlabel("t [s]")
axs3.set_ylim(-1, 1)
axs3.legend()
plt.tight_layout()

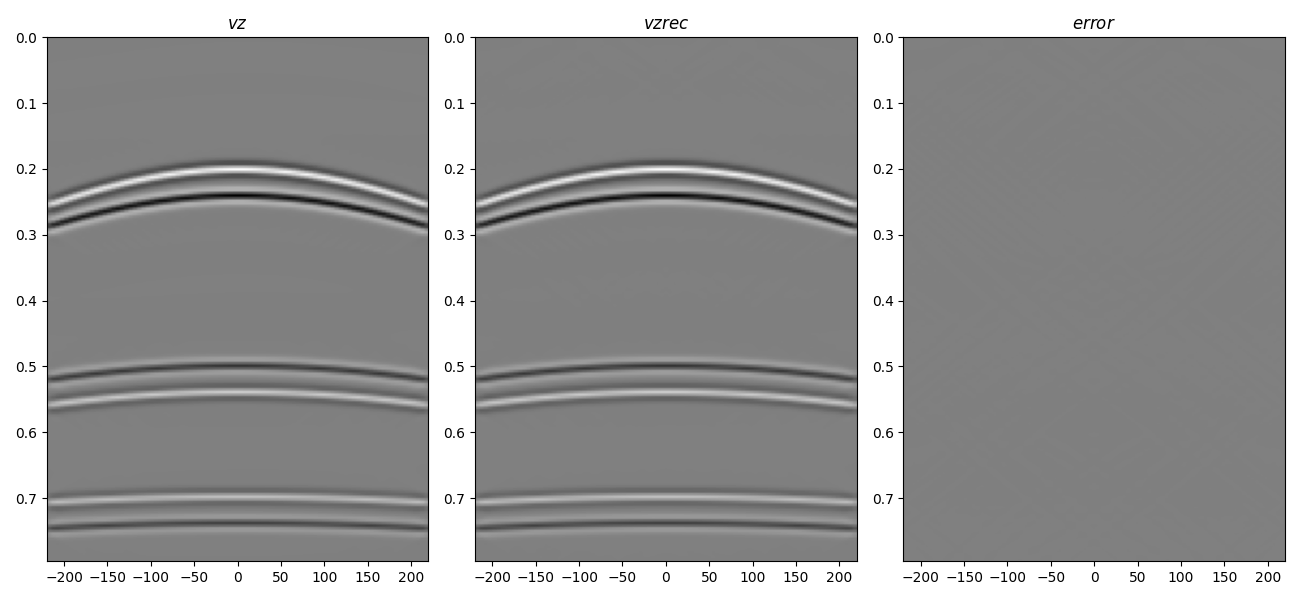
The up- and down-going constituents have been succesfully separated in both
cases. Finally, we use the
pylops.waveeqprocessing.UpDownComposition2D operator to reconstruct
the particle velocity wavefield from its up- and down-going pressure
constituents
PtoVop = pylops.waveeqprocessing.PressureToVelocity(
    par["nt"],
    par["nx"],
    par["dt"],
    par["dx"],
    rho_sep,
    vel_sep,
    nffts=(nfft, nfft),
    critical=critical * 100.0,
    ntaper=ntaper,
    topressure=False,
)

vdown_rec = (PtoVop * pdown_inv.ravel()).reshape(par["nx"], par["nt"])
vup_rec = (PtoVop * pup_inv.ravel()).reshape(par["nx"], par["nt"])
vz_rec = np.real(vdown_rec - vup_rec)

fig, axs = plt.subplots(1, 3, figsize=(13, 6))
axs[0].imshow(
    vz.T,
    cmap="gray",
    vmin=-1e-6,
    vmax=1e-6,
    extent=(x.min(), x.max(), t.max(), t.min()),
)
axs[0].set_title(r"$vz$")
axs[0].axis("tight")
axs[1].imshow(
    vz_rec.T, cmap="gray", vmin=-1e-6, vmax=1e-6, extent=(x.min(), x.max(), t[-1], t[0])
)
axs[1].set_title(r"$vz rec$")
axs[1].axis("tight")
axs[2].imshow(
    vz.T - vz_rec.T,
    cmap="gray",
    vmin=-1e-6,
    vmax=1e-6,
    extent=(x.min(), x.max(), t[-1], t[0]),
)
axs[2].set_title(r"$error$")
axs[2].axis("tight")
plt.tight_layout()

To see more examples, including applying wavefield separation and regularization simultaneously, as well as 3D examples, head over to the following notebooks: notebook1 and notebook2
Total running time of the script: (0 minutes 16.070 seconds)
